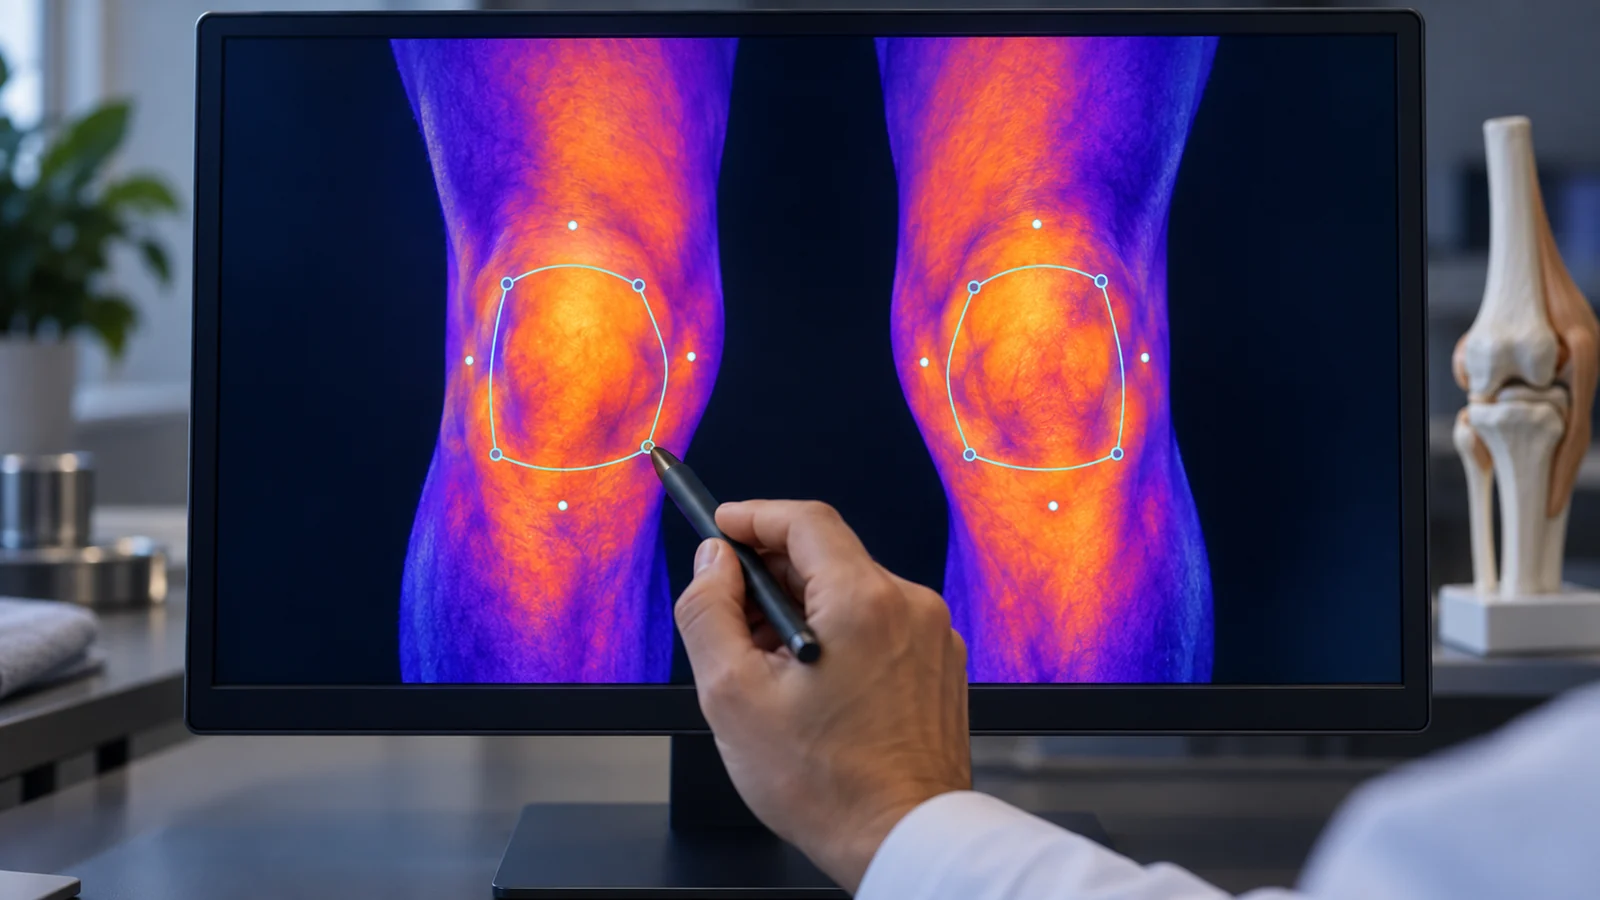
The thermal asymmetry that separates a normal limb pair from a suspicious one is narrow. In a reference study of 39 healthy men, the largest mean side-to-side temperature difference across regions was 0.4 °C, with a standard deviation of 0.3 °C in whole-body views and 0.15 °C in regional views. Clinical thresholds for a meaningful asymmetry are commonly placed between 0.5 and 0.7 °C.
That leaves a working margin of one to three tenths of a degree between normal variation and a finding that deserves attention. Every step of the measurement chain spends some of that margin: the camera, the room, the acclimatization period, the patient's posture. One step spends more of it than any other, and it is the step clinicians control most directly and standardize least.
It is the region of interest: the box, circle or polygon drawn on the image to turn a continuous temperature field into a single number.
The Step Where an Image Becomes a Number
A thermogram contains tens of thousands of temperature readings. A clinical report contains a handful. The region of interest, or ROI, is the compression step between the two. Its mean, maximum or minimum becomes the temperature for that anatomical site, and the difference between two such regions becomes the ΔT on which a clinical impression rests.
Three properties of the ROI determine that number: where its boundary falls, how large it is, and which statistic is taken from it. Change any one and the ΔT moves.
The reliability literature has been candid about the consequence. In a 2013 study of interexaminer reliability in complex regional pain syndrome, three independent examiners evaluated thermograms of 28 patients. Agreement was good, with an intraclass correlation coefficient (ICC) of 0.865 and a 95 percent confidence interval of 0.748 to 0.933.
The authors also identified why it was not higher. There are no validated, standardized guidelines for determining regions of interest, so each observer may draw them differently on the same image.
An ICC of 0.865 is a respectable figure for a manual task. It also means that roughly one part in seven of the variance in readings was not attributable to differences between patients but to examiner variation and residual error, and the authors pointed to region placement as the leading candidate.
How Much a Boundary Can Move the Measurement
A 2026 study in the Journal of Functional Morphology and Kinesiology quantified this in a sports-medicine setting. Two independent raters manually segmented 20 thermal images of professional Canadian Football League players, covering the frontal knee and the vastus medialis oblique (VMO), using commercial analysis software.
For the frontal knee, agreement was excellent: ICC 0.991 for maximum, 0.995 for mean and 0.964 for minimum temperature. For the VMO, the mean held at 0.981, but the minimum temperature fell to an ICC of 0.779. One image produced a 4.6 °C discrepancy between raters. The cause was a boundary that overlapped cooler peripheral skin in one rater's region and not the other's.
The same study compared manual regions against automatic segmentation. Mean differences were 0.039 °C at the knee and 0.128 °C at the VMO. The second figure is a third of the entire healthy-variation margin, consumed before the patient's physiology has contributed anything.
Two lessons follow. The minimum statistic is hostage to a handful of pixels at the boundary, which is why it diverged between raters far more than the mean did. And a region drawn over a muscle belly is more sensitive to boundary placement than one drawn over a joint, because the surrounding temperature gradient is steeper.
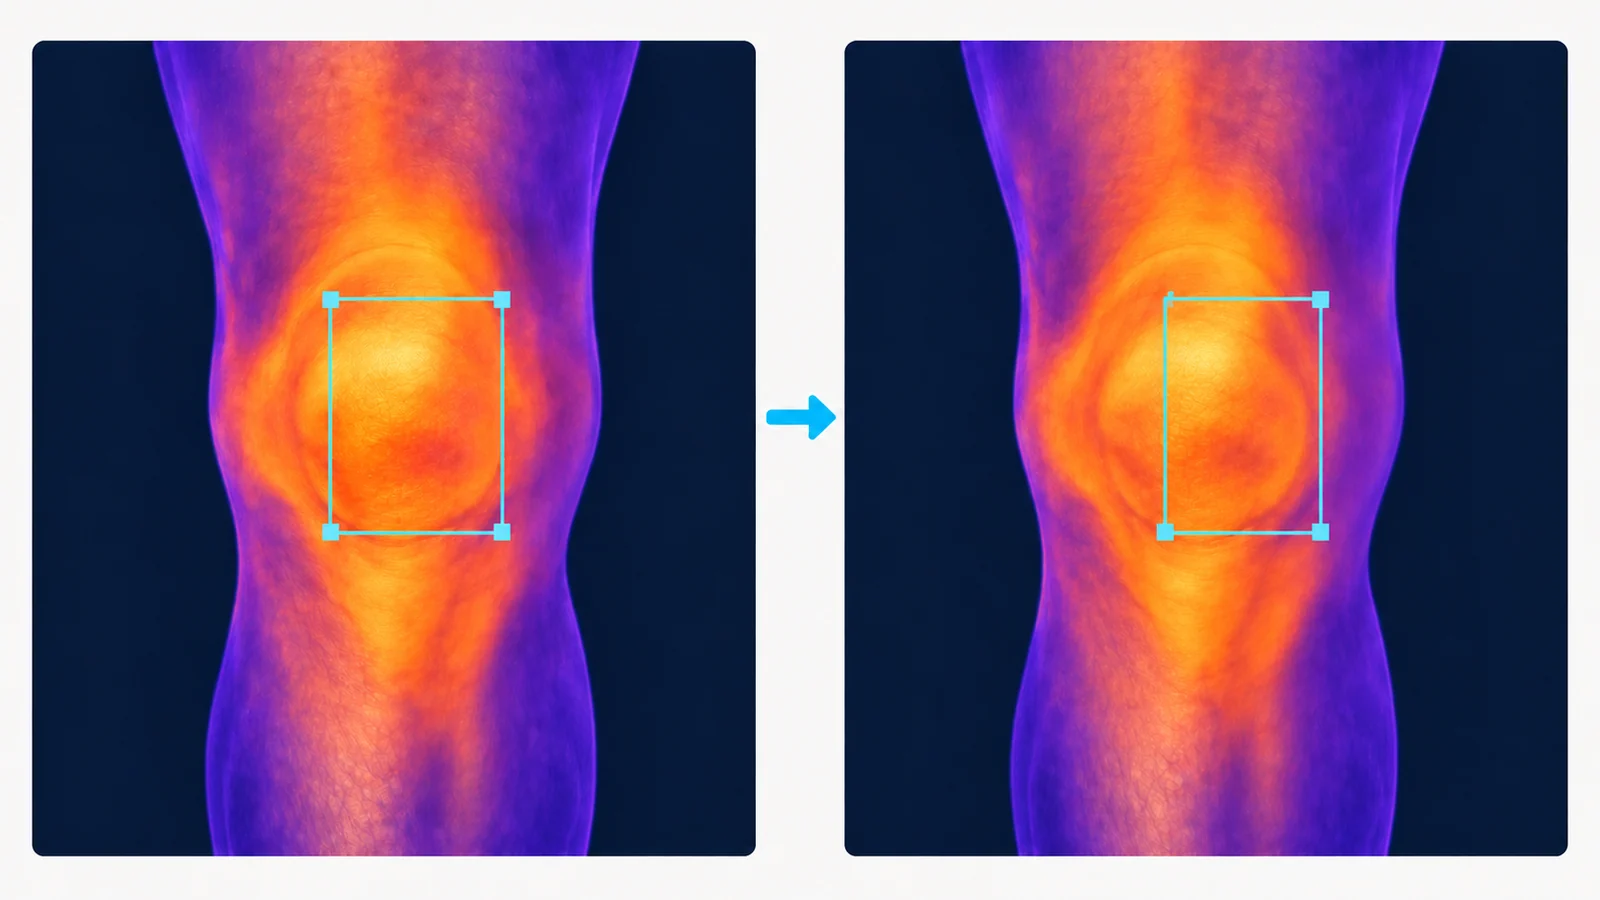
Conceptual illustration, without measured values: both panels show the same thermal field. Moving a region toward cooler peripheral skin changes which pixels are sampled and can change the reported temperature.
Why Mirroring the Region Is Not Enough
Bilateral comparison is the foundation of clinical thermography, and the obvious way to place the contralateral region is to mirror the first one across the midline. In practice, mirror reflection is unreliable.
Patients are not positioned symmetrically. One foot is slightly externally rotated. One shoulder sits lower. The camera is a degree off perpendicular. A mirrored box lands on the intended anatomy on one side and on the edge of it on the other. The measured ΔT then contains a positioning artifact that looks exactly like a physiological asymmetry.
Standardized methods reduce this. A described protocol for patellar tendon regions, anchored to visible anatomical references and applied across 68 thermograms, achieved ICC lower bounds above 0.84 with no systematic bias between raters. The improvement came from anchoring the region to anatomy rather than to image coordinates.
The longitudinal case is harder still. A ΔT at week six of rehabilitation is only comparable to the ΔT at week two if the two regions covered the same tissue. A region stored as pixel coordinates cannot promise that. A region stored relative to anatomical landmarks can.
Landmark Registration as the Alternative
Landmark registration means identifying stable anatomical points in the image (the patella, the malleoli, the acromion) and defining regions relative to those points rather than to the image grid. The corresponding region on the opposite limb, or in a later session, is then derived by mapping the landmarks, using a transform that preserves the region's area so that the two samples remain comparable in size.
The clinical value of this is not automation for its own sake. A region tied to the patella is the same region whether the patient stands a few degrees rotated, sits lower on the plinth, or returns three weeks later with a different camera operator. The geometry adapts; the anatomy sampled does not.
Vizbodx filed a provisional patent application for this approach on September 2, 2026, under the title "Clinician-Initiated Region-of-Interest Placement via Anatomical Landmark Registration in Infrared Thermal Imagery." Once the clinician places a region, the system proposes the corresponding region on the other side of the body, on the same side, or in a subsequent imaging session.
The clinician must confirm, adjust or reject the proposal before any measurement is recorded. Nothing is stored on the algorithm's word alone.
Mayco Anderson Moreira, Vizbodx co-founder and CTO, described the intent in the company's announcement: registering regions to anatomical landmarks improves consistency across bilateral comparisons and over time, while still requiring clinician confirmation. Barry Hix, co-founder and CEO, framed it within the company's broader Clinician-First AI architecture, in which software automates repetitive workflow tasks while medical professionals remain in control of interpretation.
For longitudinal monitoring, regions are stored relative to landmarks rather than pixel coordinates, so that a trajectory of ΔT values across sessions reflects the tissue and not the drawing.
What This Means at the Point of Care
The measurement-science argument reduces to a short protocol for any clinician who reports thermal asymmetry.
- Define regions by anatomy, not by eye. Write down the landmark rule for each site and apply the same rule every time. The Glamorgan Protocol, published in 2008, remains the most widely referenced attempt at standard views and regions for the human body.
- Prefer the mean. Report minimum or maximum only when the clinical question demands it, and expect them to be less reproducible.
- Treat the contralateral region as its own placement problem. Do not assume a mirrored box sits on the same tissue.
- Store regions for follow-up. A longitudinal series is only as good as the consistency of its regions across visits.
- Confirm any automated proposal. Software can find corresponding anatomy faster than a hand can; it should not decide alone that the anatomy is right.
Document the region definition in the report. A ΔT without the rule that produced it cannot be reproduced by the next clinician and cannot be compared with the next session. Stating the landmark rule, the statistic and the image view turns a number into a measurement.
None of this changes what infrared imaging is. Medical thermography remains an adjunct to clinical judgment that provides objective physiological data to support assessment. Its objectivity, though, is only as strong as the reproducibility of the number it produces.
The Number Is the Product
Clinicians rarely argue about the camera. Modern sensors resolve hundredths of a degree. The room can be controlled, the acclimatization timed, the posture standardized. The step that has resisted standardization is the one that happens after the image is captured, when a human being decides where the region goes.
Anchoring that decision to anatomy, proposing the matching region automatically, and requiring the clinician to confirm it is not a convenience feature. It is how a ΔT of 0.6 °C earns the right to be called a finding rather than an artifact.
Recovery begins with discovery. Discovery begins with a measurement that means the same thing every time it is made.
Vizbodx Inc. is developing AI-powered infrared medical imaging technology designed to detect asymmetric thermal patterns in sports medicine, occupational health and musculoskeletal recovery, often before symptoms emerge. Vizbodx software is an adjunct to clinical judgment; it does not diagnose.
Recovery begins with discovery.
→ Read the Vizbodx announcement of the region-of-interest patent filing → Learn more about Vizbodx
References
- Vardasca R, Ring EFJ, Plassmann P, Jones CD. Thermal symmetry of the upper and lower extremities in healthy subjects. Thermology International. 2012;22(2):53-60. https://www.researchgate.net/publication/227860586_Termal_symmetry_of_the_upper_and_lower_extremities_in_healthy_subjects
- Choi E, Lee PB, Nahm FS. Interexaminer reliability of infrared thermography for the diagnosis of complex regional pain syndrome. Skin Research and Technology. 2013;19(2):189-193. https://pubmed.ncbi.nlm.nih.gov/23331254/
- Accurso, Couturier, Castonguay, Lamoureux, Dover. Manual vs. Automatic Segmentation in Infrared Thermography: Inter-Rater Reliability and a Longitudinal Single-Case Feasibility Illustration of Agreement for Musculoskeletal Rehabilitation Monitoring. Journal of Functional Morphology and Kinesiology. 2026. https://pmc.ncbi.nlm.nih.gov/articles/PMC13510409/
- Inter and intraexaminer reliability of a new method of infrared thermography analysis of patellar tendon. Quantitative InfraRed Thermography Journal. 2021;18(2). https://www.tandfonline.com/doi/abs/10.1080/17686733.2019.1700697
- Ammer K. The Glamorgan Protocol for recording and evaluation of thermal images of the human body. Thermology International. 2008;18(4):125-144. https://www.researchgate.net/publication/233420893_The_Glamorgan_Protocol_for_recording_and_evaluation_of_thermal_images_of_the_human_body
- Vizbodx Inc. Vizbodx Expands Clinician-First AI Architecture with Third Patent Filing. PR Newswire, September 14, 2026. https://www.prnewswire.com/news-releases/vizbodx-expands-clinician-first-ai-architecture-with-third-patent-filing-302878061.html